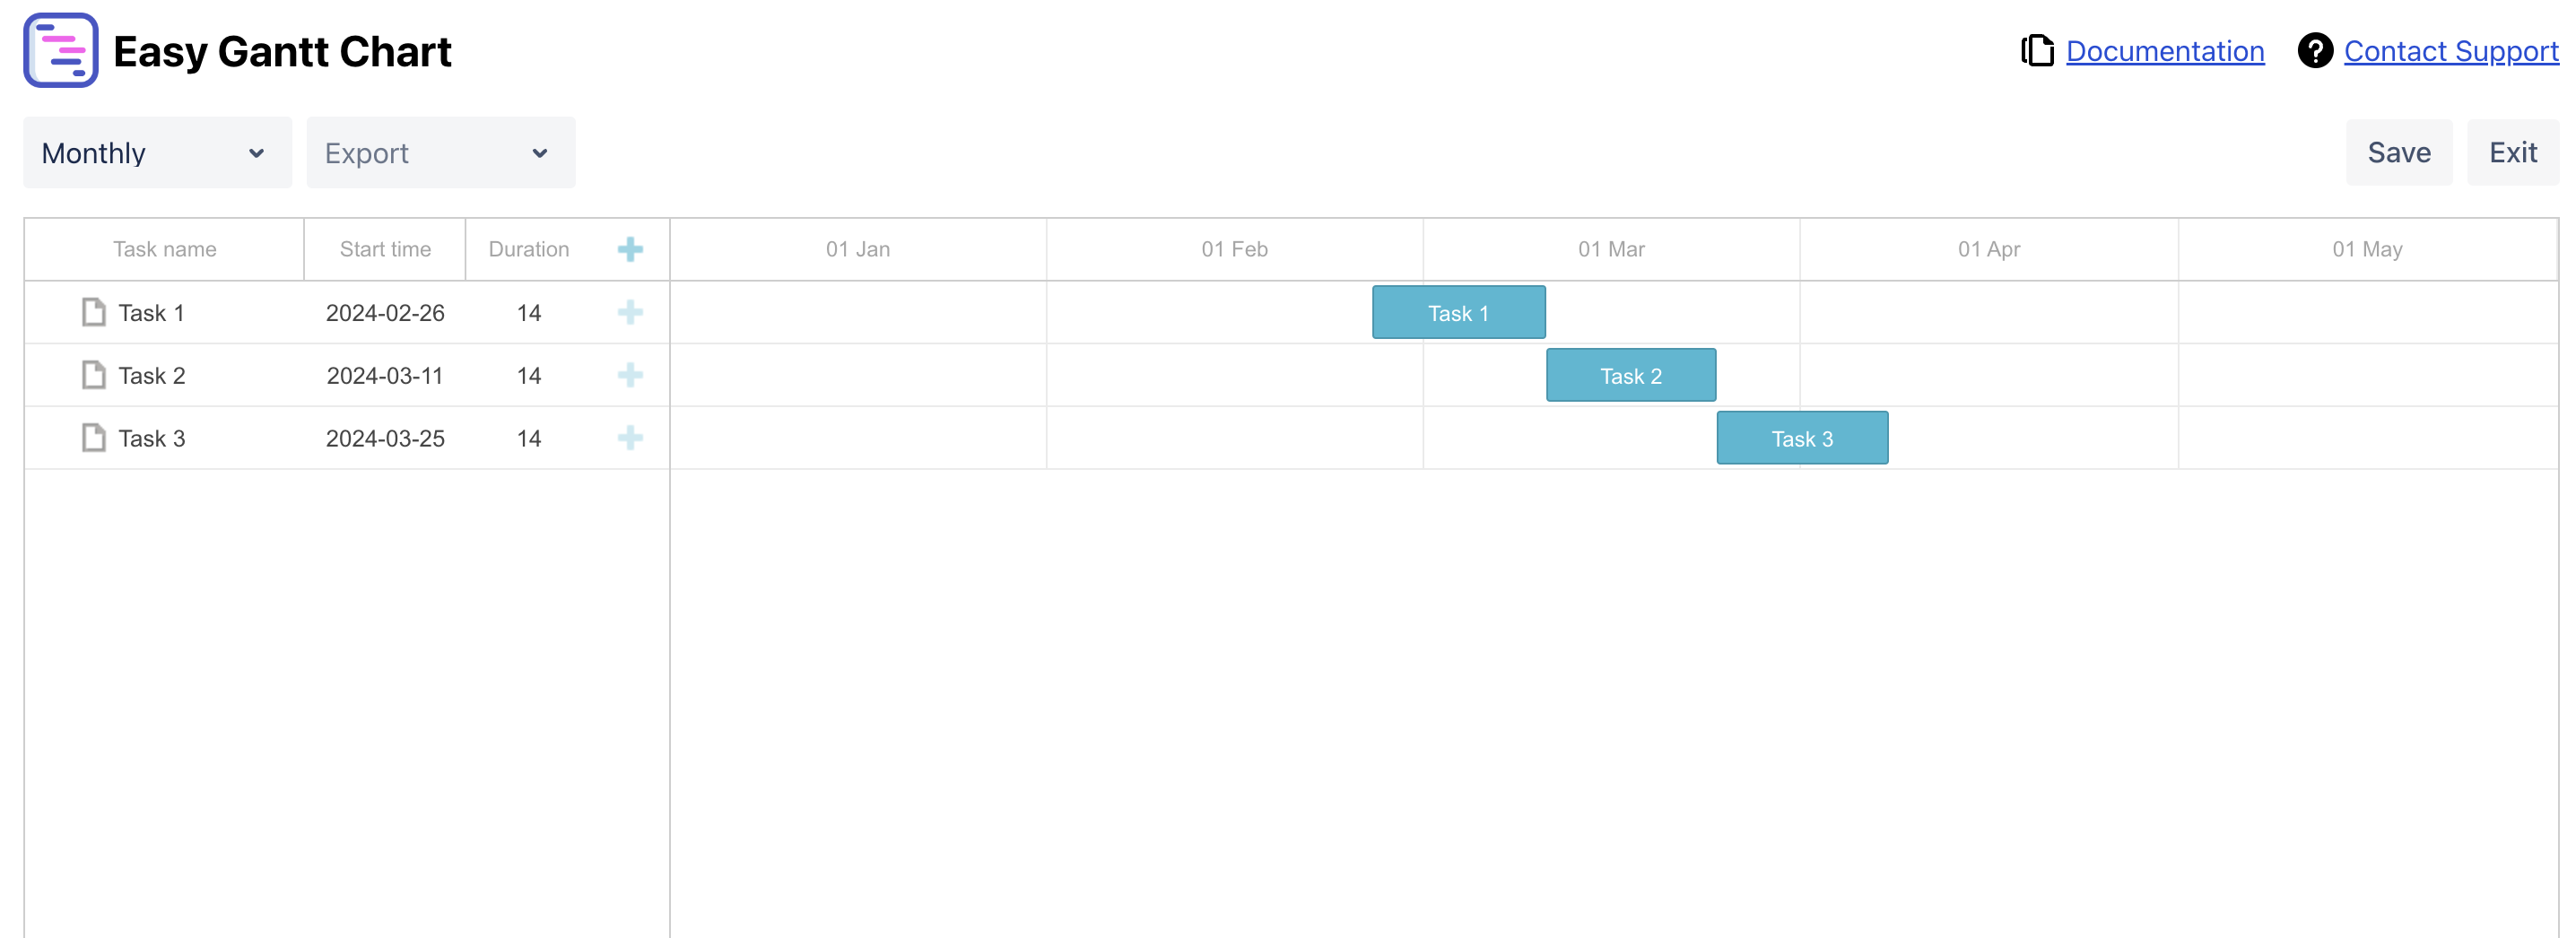
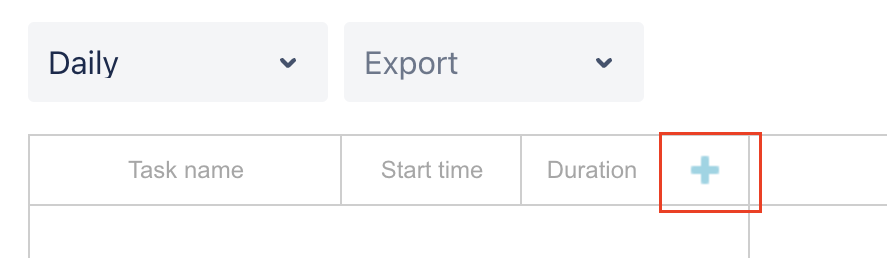
Create tasks
Create a new chart by adding tasks. Click on the plus button to simply add a task and set the timeline.
Save and export
In order to save, please click ‘Save’ and update the Confluence page. The chart will not be updated if the Confluence page is not updated as well.
In order to export the chart to your local, please click ‘Export’ and select to export to PDF or Excel file.
View chart in different scales
User can display the chart by daily, weekly, monthly, quarterly, or yearly.