Use Label Report gadget to do advanced reporting on label fields. It gives better visualization of a selected labels in different chart types: bar, line and pie charts.
Follow the steps below to add a Label Report:
.gif?cb=35e450ad580b39d24a7ece0473fd9943)
-
Go to a Jira dashboard and click edit
-
Then click on Add Gadget
-
Search for Label Report and click Add
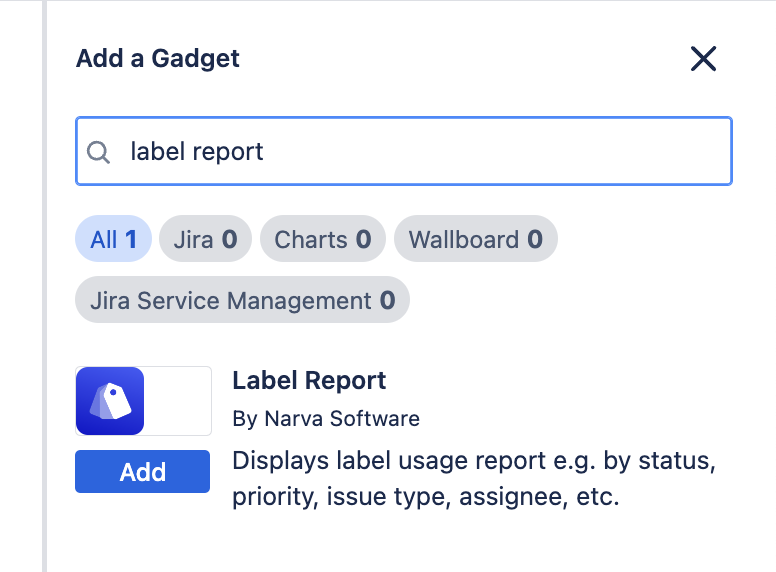
If you do not see the gadget above, please ensure that you have installed the Advanced Label Manager.
-
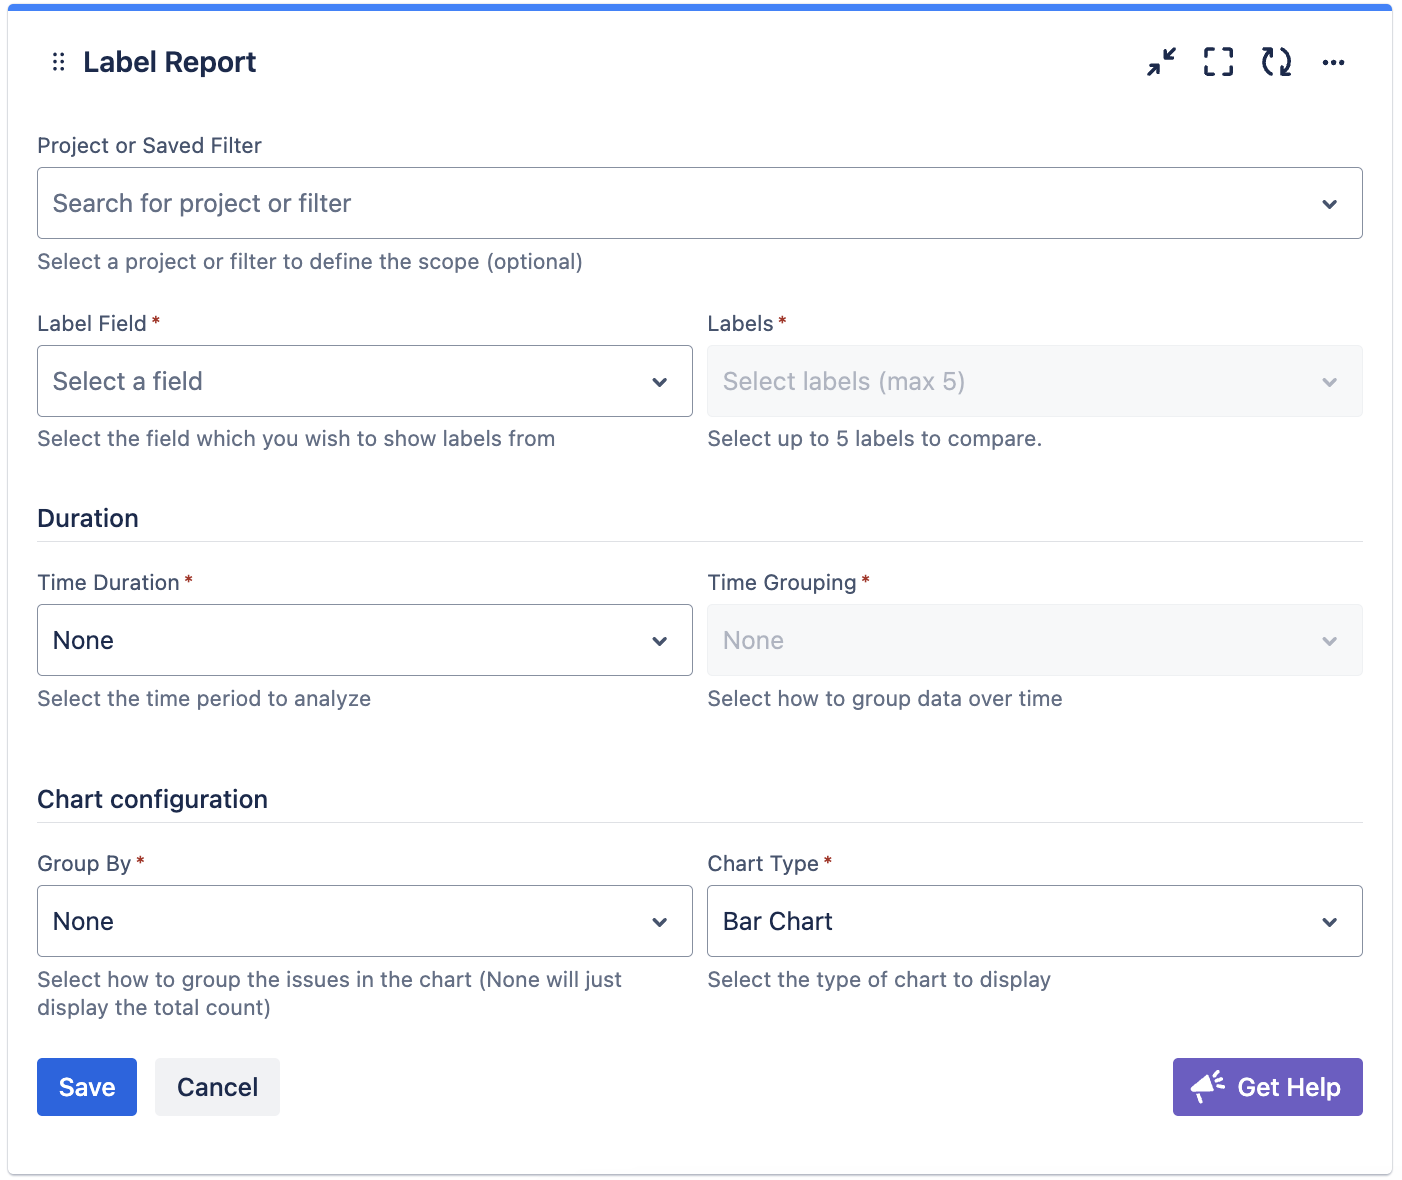
Select a label field. Jira default field is named “Labels”.
-
Select a label or multiple labels you’d like to quantify into the chart.
-
Select a chart type. The gadget supports bar chart, donut chart, and pie chart.
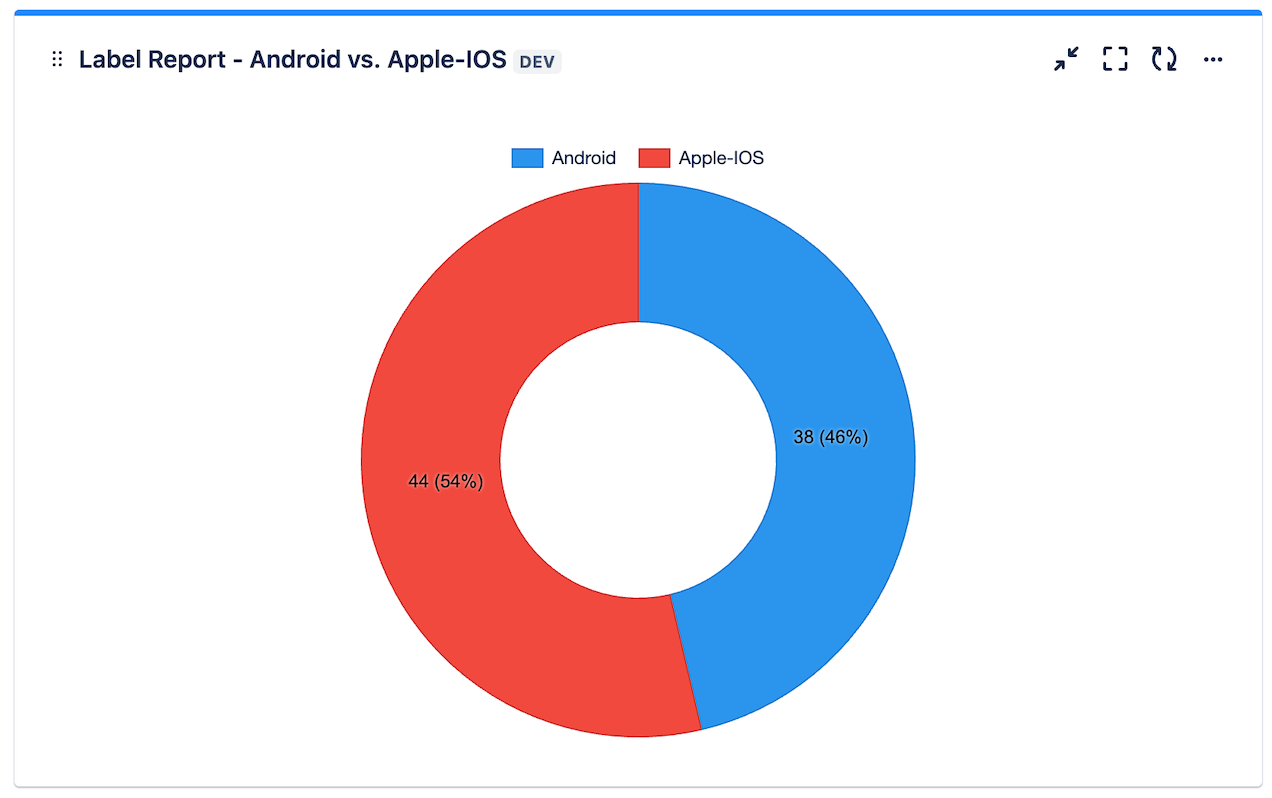
Visualize labels over time
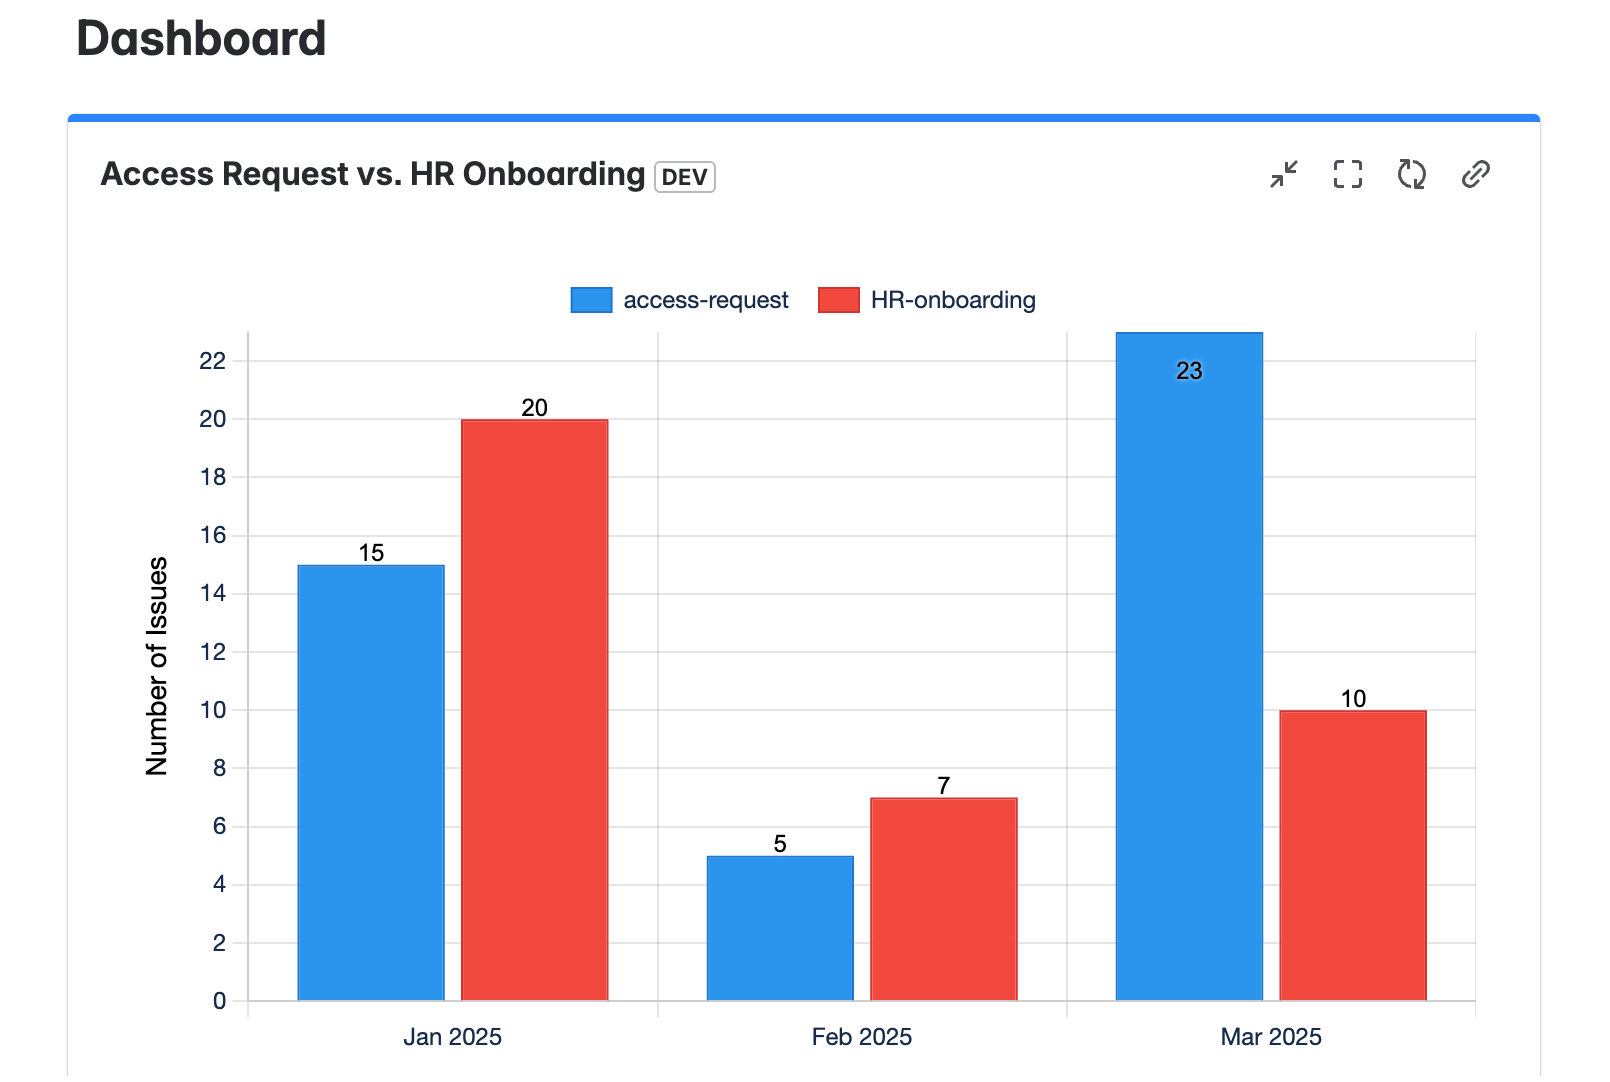
You can group labels by the time the labels are tagged. The chart below shows JSM request types by labels “HR onboarding” and “Access Requests” by month.
To set this, add the time configuration on the gadget under “Duration”:
-
Select the fields and the labels you’d like to show on the chart.
-
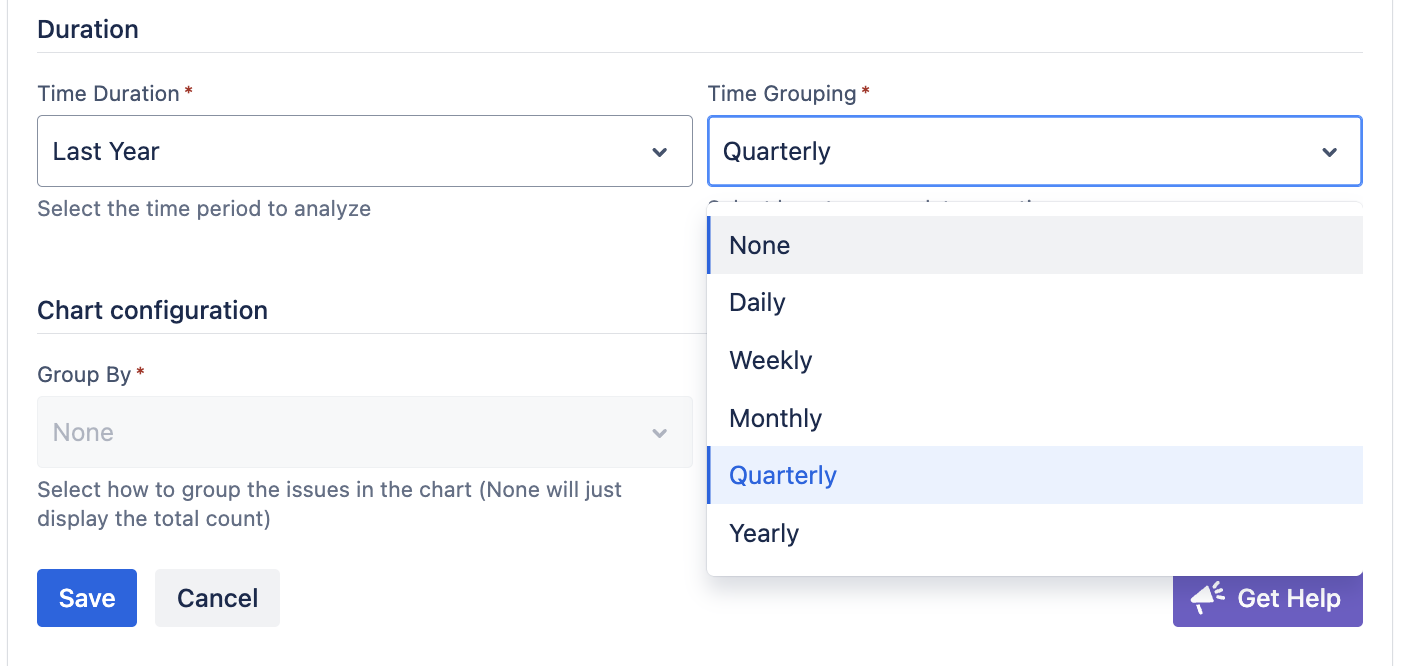
Select time duration
-
Select how you’d like to group the labels (weekly, monthly, etc.)